The election that mattered most to Minnesota in 2016 was the battle for control of the State Capitol, and especially the hotly contested House.
Republicans successfully fended off the DFL and expanded their House majority, while capturing the Senate for just the second time in four decades. Campaign finance data detailing contributions and spending in 2016, released Feb. 1, 2017, show big money flowed into the most competitive races, with 60 percent being spent in just 26 districts between the House and Senate.
The maps below show total spending in each state House and Senate district, combining candidate spending with independent expenditures made for or against those candidates by outside political groups, according to data from the Minnesota Campaign Finance and Public Disclosure Board. Candidate expenditures include direct campaign spending and transfers to other committees.
Outside groups – meaning not the candidates, parties or caucuses -- spent more than $20 million on House and Senate races in 2016. Unlike candidates, outside groups don't have to abide by contribution limits, which allows them to take in and spend far more.
Read more Star Tribune coverage of campaign spending here and here, as well as a story that focuses on the independent expenditures.
Click on a district in one of the maps, or use the search tools below, to see details, including how much each candidate raised through donations.

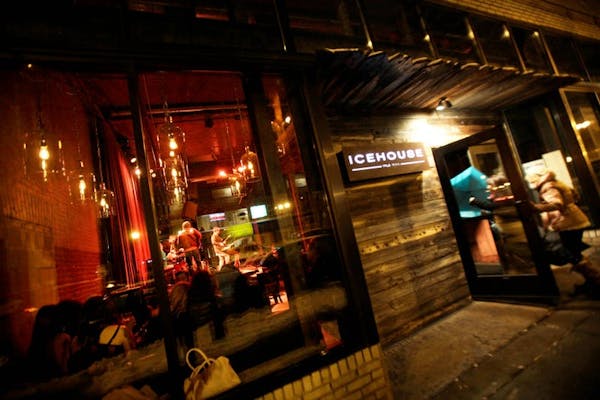
Minneapolis considers bid to host Sundance Film Festival

Teen suspect in Nudieland mass shooting arrested on murder, assault charges
'Human error' behind Robbinsdale shelter-in-place alert that was mistakenly sent countywide
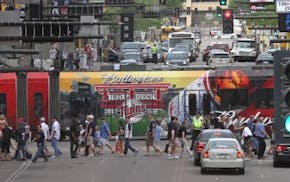
Going to Wolves or Twins tonight? How to get there (and maybe avoid traffic).